


The situation
where we looked first
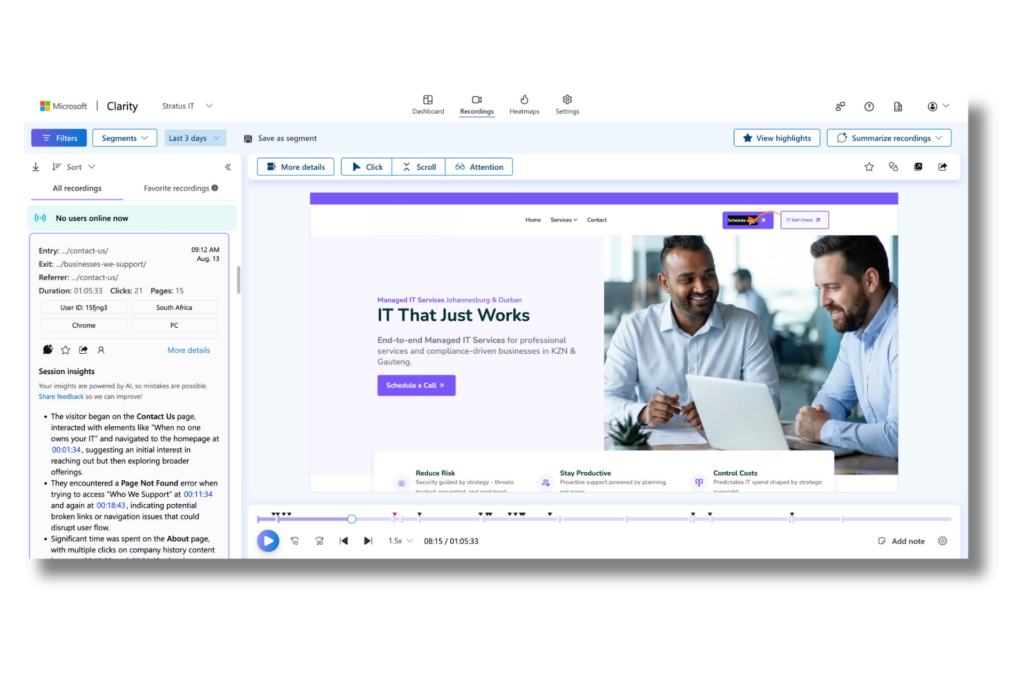
What was causing the poor ad performance
What changed after the fix
The fix went live in late July. Comparing 1-10 August against 1-10 July in GA4:
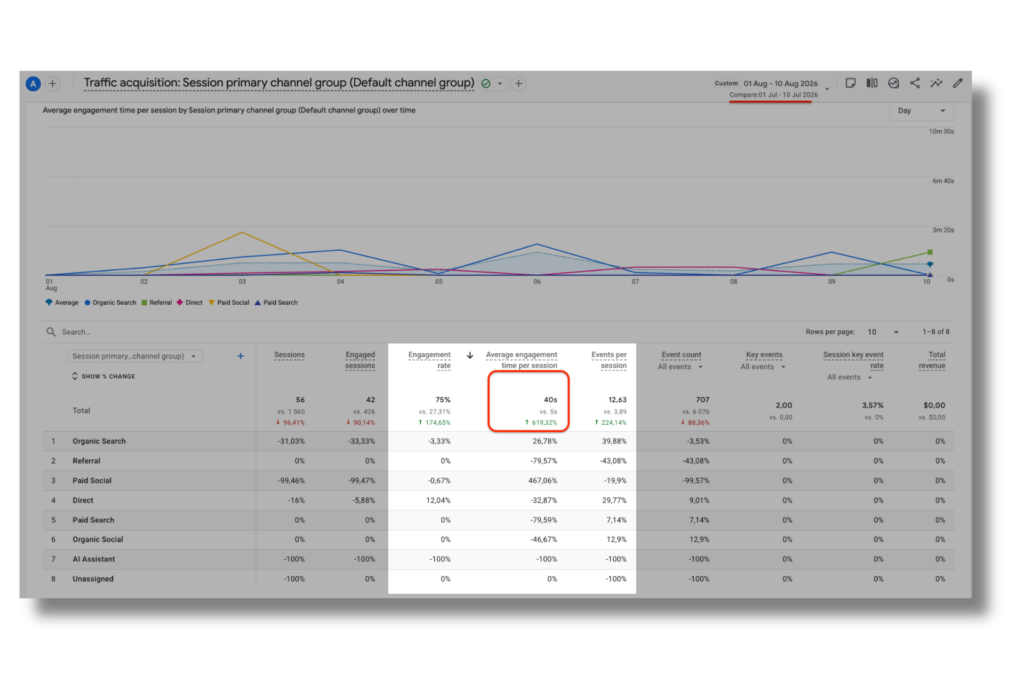
Total sessions are down sharply in that window because the paid campaigns are still paused, so this isn’t a like-for-like comparison on volume. What it does show is that the people who do land on the site now behave completely differently. Engagement rate has nearly tripled, average time on page is up more than six times, and visitors are triggering over three times as many events per session.
We’re now ready to switch the campaigns back on and test the improved experience at full traffic volume, while we keep watching the Clarity recordings to make sure the form is loading reliably for everyone and not just a recovering sample.
What we learnt from this
1. Your campaign metrics can look perfect while your marketing fails. Click-through rate, cost per click and impressions all measure what happens before someone reaches your website. None of them tell you whether the site can actually convert the person once they arrive.
3. Watch real people, don’t just read reports. Ten minutes of session recordings told us more than weeks of analytics did. Tools like Microsoft Clarity are free and take minutes to install.
4. Beautiful and functional aren’t the same thing. This was a new site built to a high standard, and it still had something that was quietly costing leads. Being well designed doesn’t exempt a site from being tested.
5. When something isn’t working, stop spending and find out why. Continuing to run a campaign while you hope it comes right is the most expensive option available to you.
in conclusion
Not sure whether your website is costing you leads?
Related articles:


